Show POH PerHeapHistoryData in Raw XML view#1379
Conversation
45f2b72 to
171448d
Compare
|
other than what I mentioned in this comment it LGTM! |
|
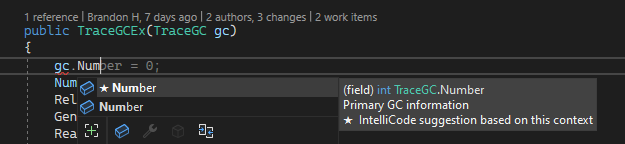
This PR performed the following breaking change: We have code in our codebase like this: public TraceGCEx(TraceGC gc)
{
Number = gc.Number;
RelativeTimestamp = gc.StartRelativeMSec;
Generation = gc.Generation;
Reason = gc.Reason.ToString();
Type = gc.Type.ToString();
PauseTime = gc.PauseDurationMSec;
PinnedObjectsSize = (double)gc.GetPinnedObjectSizes() / (1024 * 1024);
PinnedObjectPercent = gc.GetPinnedObjectPercentage() >= 0 ? (double)gc.GetPinnedObjectPercentage() : 0;
SuspensionTime = gc.SuspendDurationMSec;
Issues = new Dictionary<string, double>();
// per heap calculations
HeapSize = HeapFragmentation = 0;
SurvivalPercent = new Dictionary<string, double>();
            for (int gen = (int)Gens.Gen0; gen < (int)Gens.Gen0After; gen++)
            {
                HeapSize += gc.HeapStats != null ? gc.GenSizeAfterMB((Gens)gen) : 0;
                HeapFragmentation += gc.GenFragmentationMB((Gens)gen);
                var surv = gc.SurvivalPercent((Gens)gen);
if (!Double.IsNaN(surv))
{
SurvivalPercent.Add(((Gens)gen).ToString(), surv);
}
}What is the recommended way forward? If I change to using |
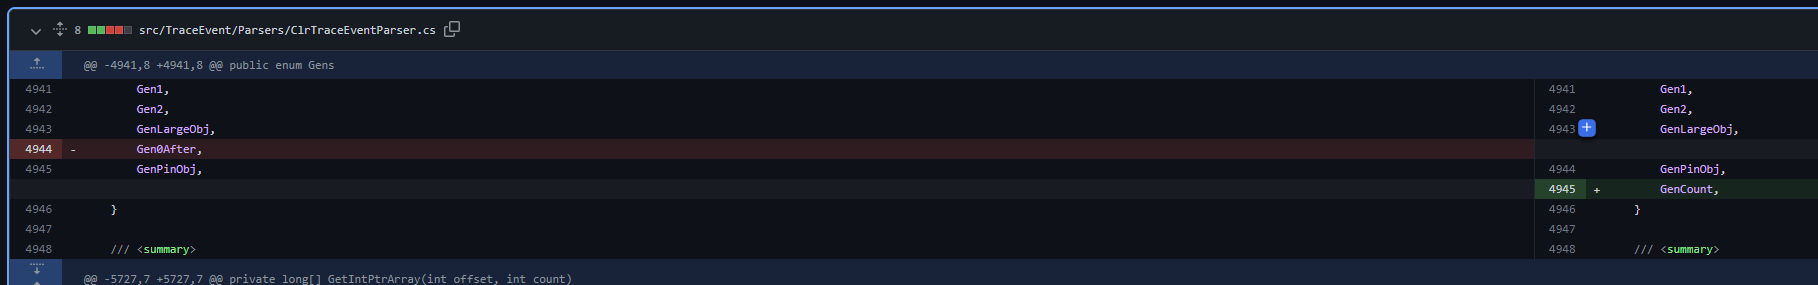
Fundamentally, the runtime introduced a new "generation" (technically, the pinned object heap is not a new generation, but it is convenient to represent it that way) in 5.0, so that bound needs to be dynamically adjusted depending on whether or not the trace was captured before 5.0 or not. To make this task easier, there is a new property named |
|
Thanks for that explanation, @cshung
I considered that, however even after updating to v3.0.4 the object we're using doesn't have that property :( Any other ideas? I'm inheriting this code so not quite sure what the right thing is ;) |
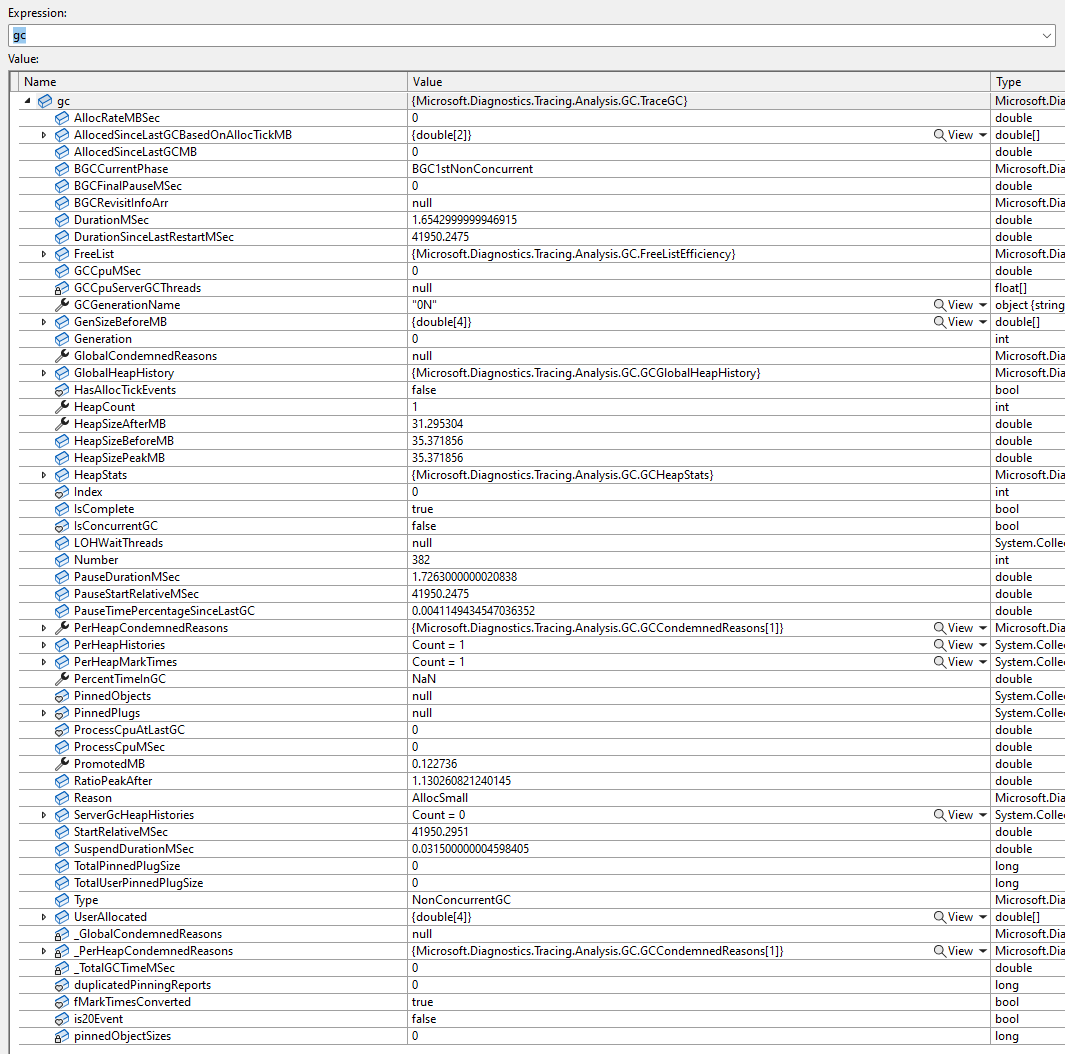
I tried to look into this, and it appears to me there are some disconnects. The new property But it appears to me all you have is a You mentioned that there is an index out of bound error when you were experimenting with the code. Do you happen to know which array are you accessing? Can you reach into that array and read the length of that array? Or surface the length of that array as a property of the |
|
Yeah the blow-up happens in the loop I posted: for (int gen = (int)Gens.Gen0; gen < (int)Gens.Gen0After; gen++)
{
HeapSize += gc.HeapStats != null ? gc.GenSizeAfterMB((Gens)gen) : 0;
HeapFragmentation += gc.GenFragmentationMB((Gens)gen);
var surv = gc.SurvivalPercent((Gens)gen);Do you need me to execute it and get details on what |
Yes, a stack trace with the TraceEvent bits included would be nice. |
|
does that shed any light on things? |
|
It looks like you have a GenSizeBeforeMB array that you could access, and the dimension is 4, which is probably the number you are looking for. What would happen if you replace Edit: Scratch that, actually the array has a hard-coded size, and much of the code in |
|
Yeah, no good.
any other ideas? |

|
This is not going to be very productive to chat here once a day or two, would you mind finding me on teams? |
|
|

This change allows us to view the POH data in the raw XML view.
@brianrob
@Maoni0