CU_MorningReport.ps1 uses data retrived from ControlUp to produce daily reports. These can be useful to provide data to those who do not have access to ControlUp Insights as well as for tracking some metrics day to day that are currently presented in the ControlUp Console but not in any of the ControlUp Insights dashboards.
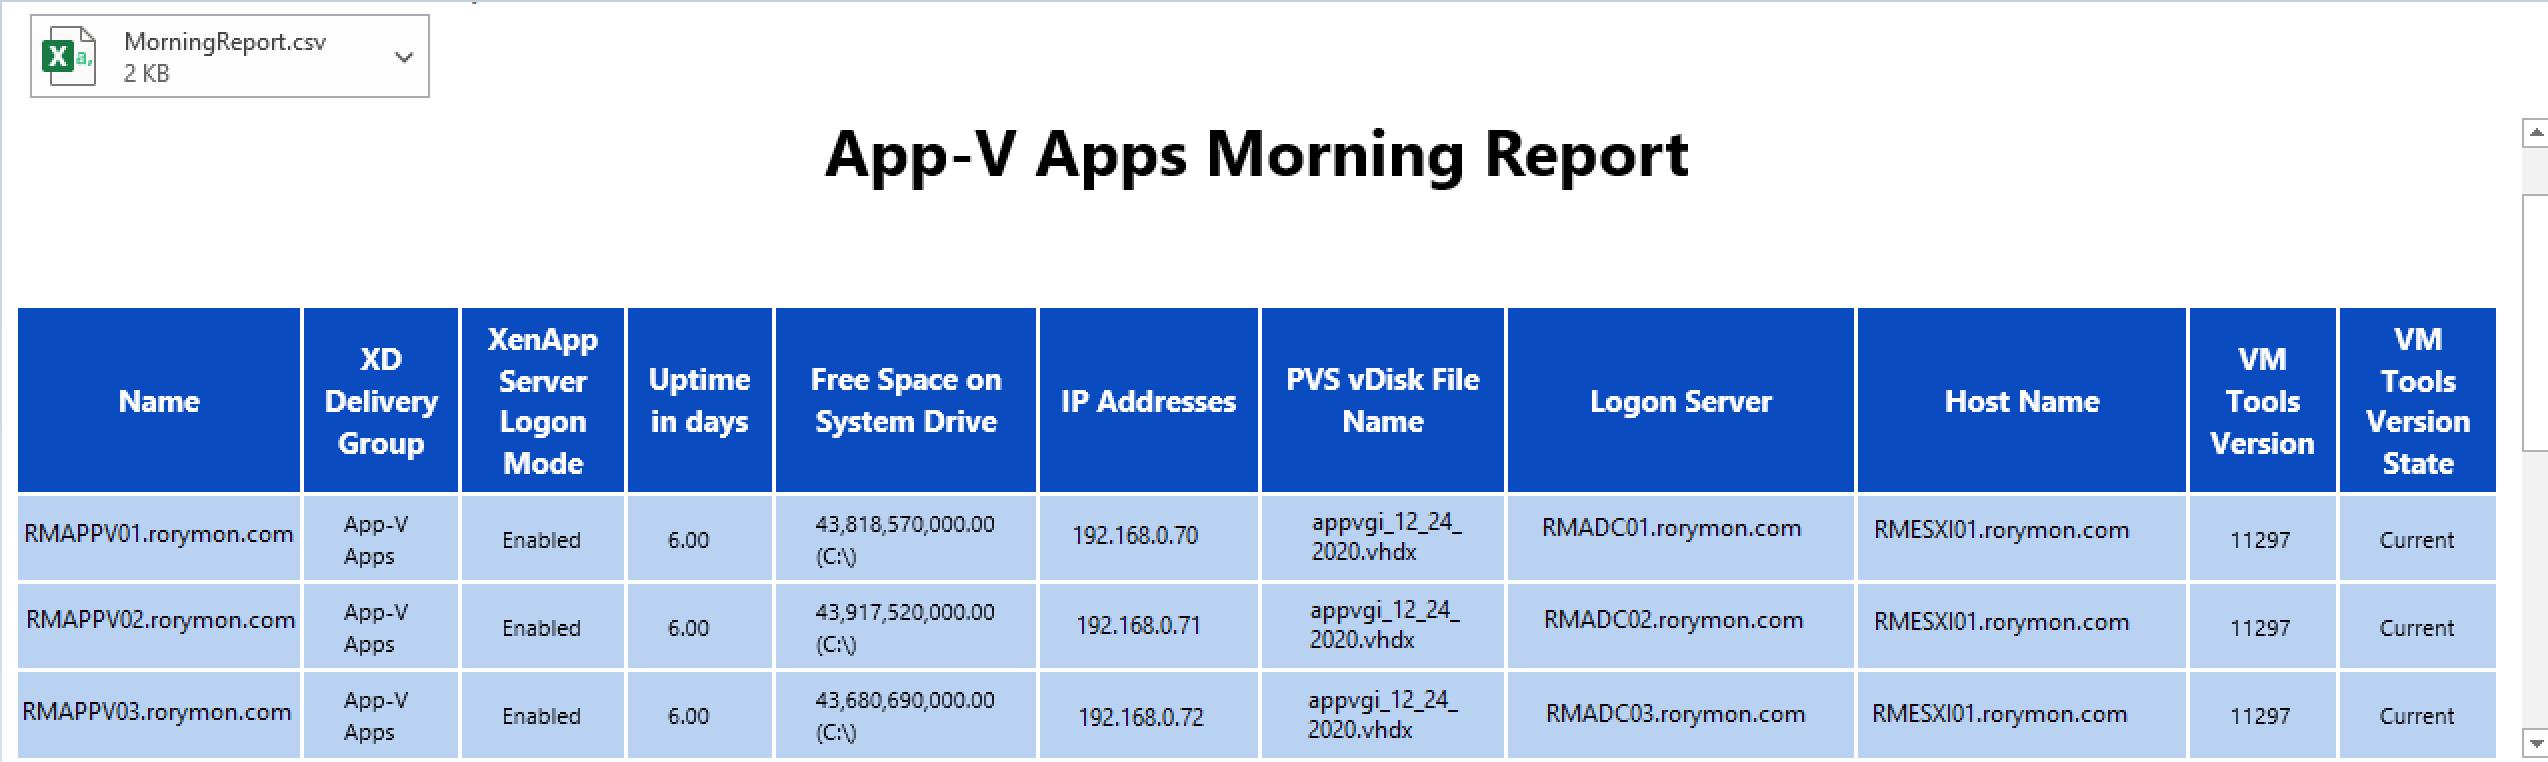
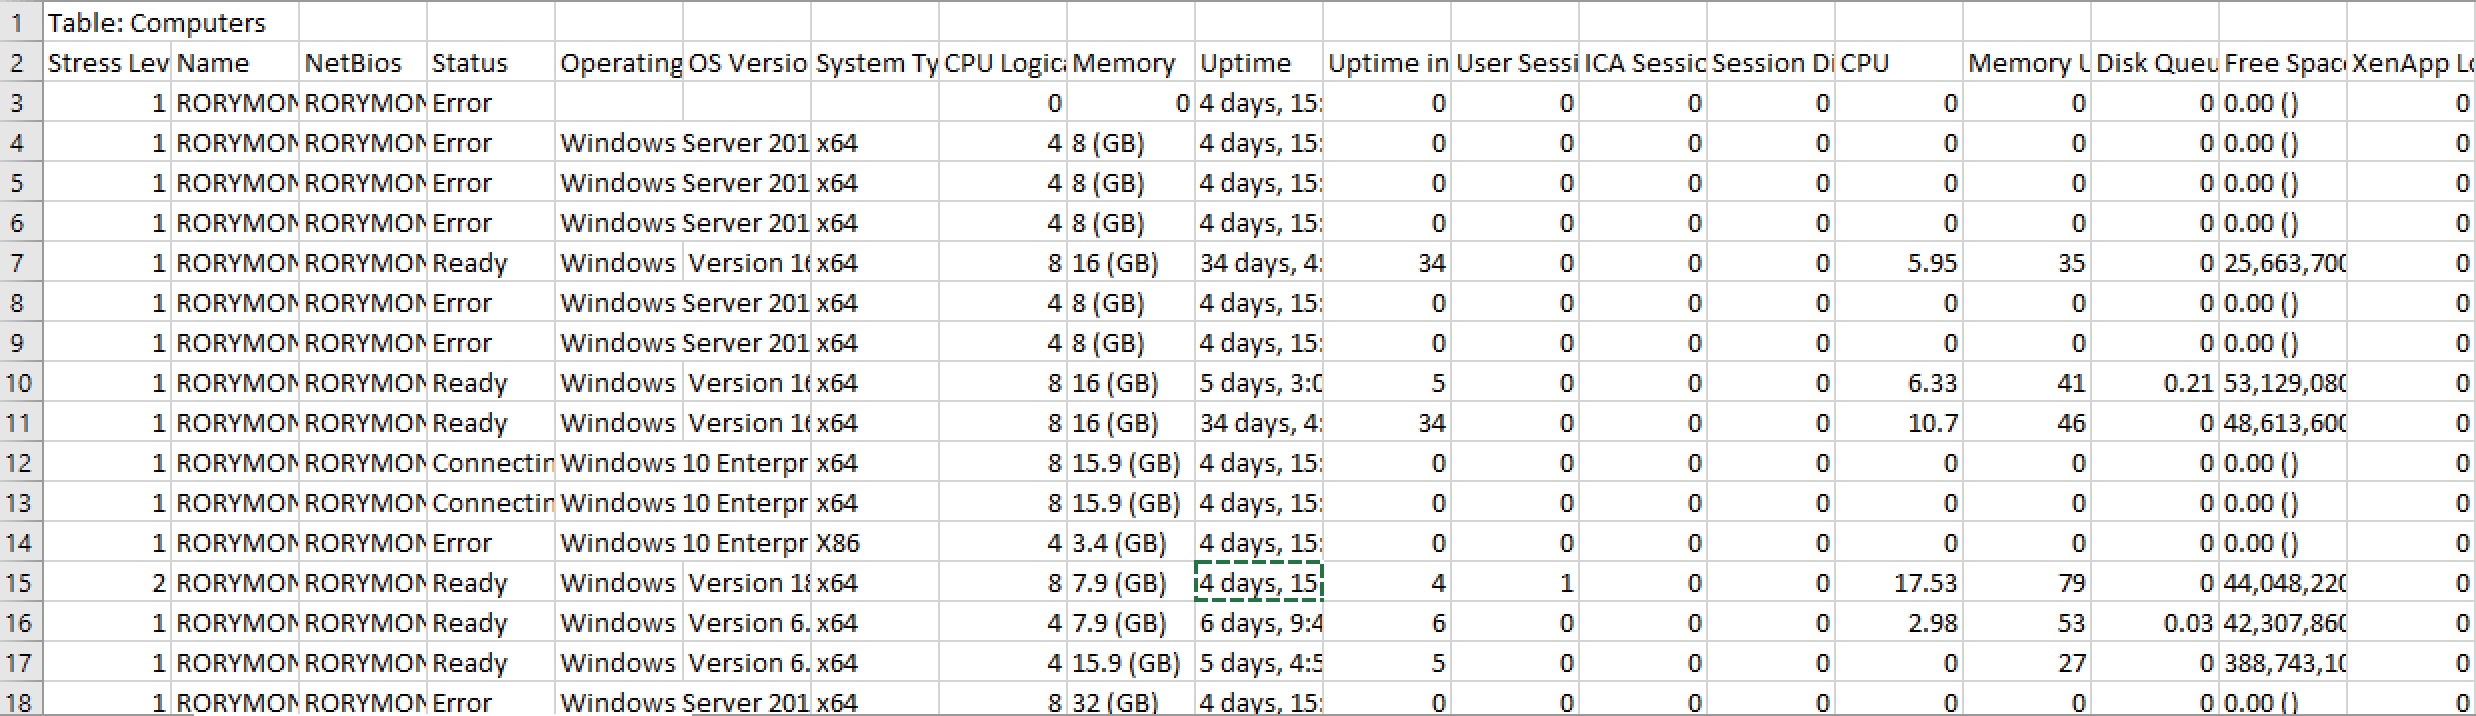
Above you can see an example of the morning report using the default configuration.
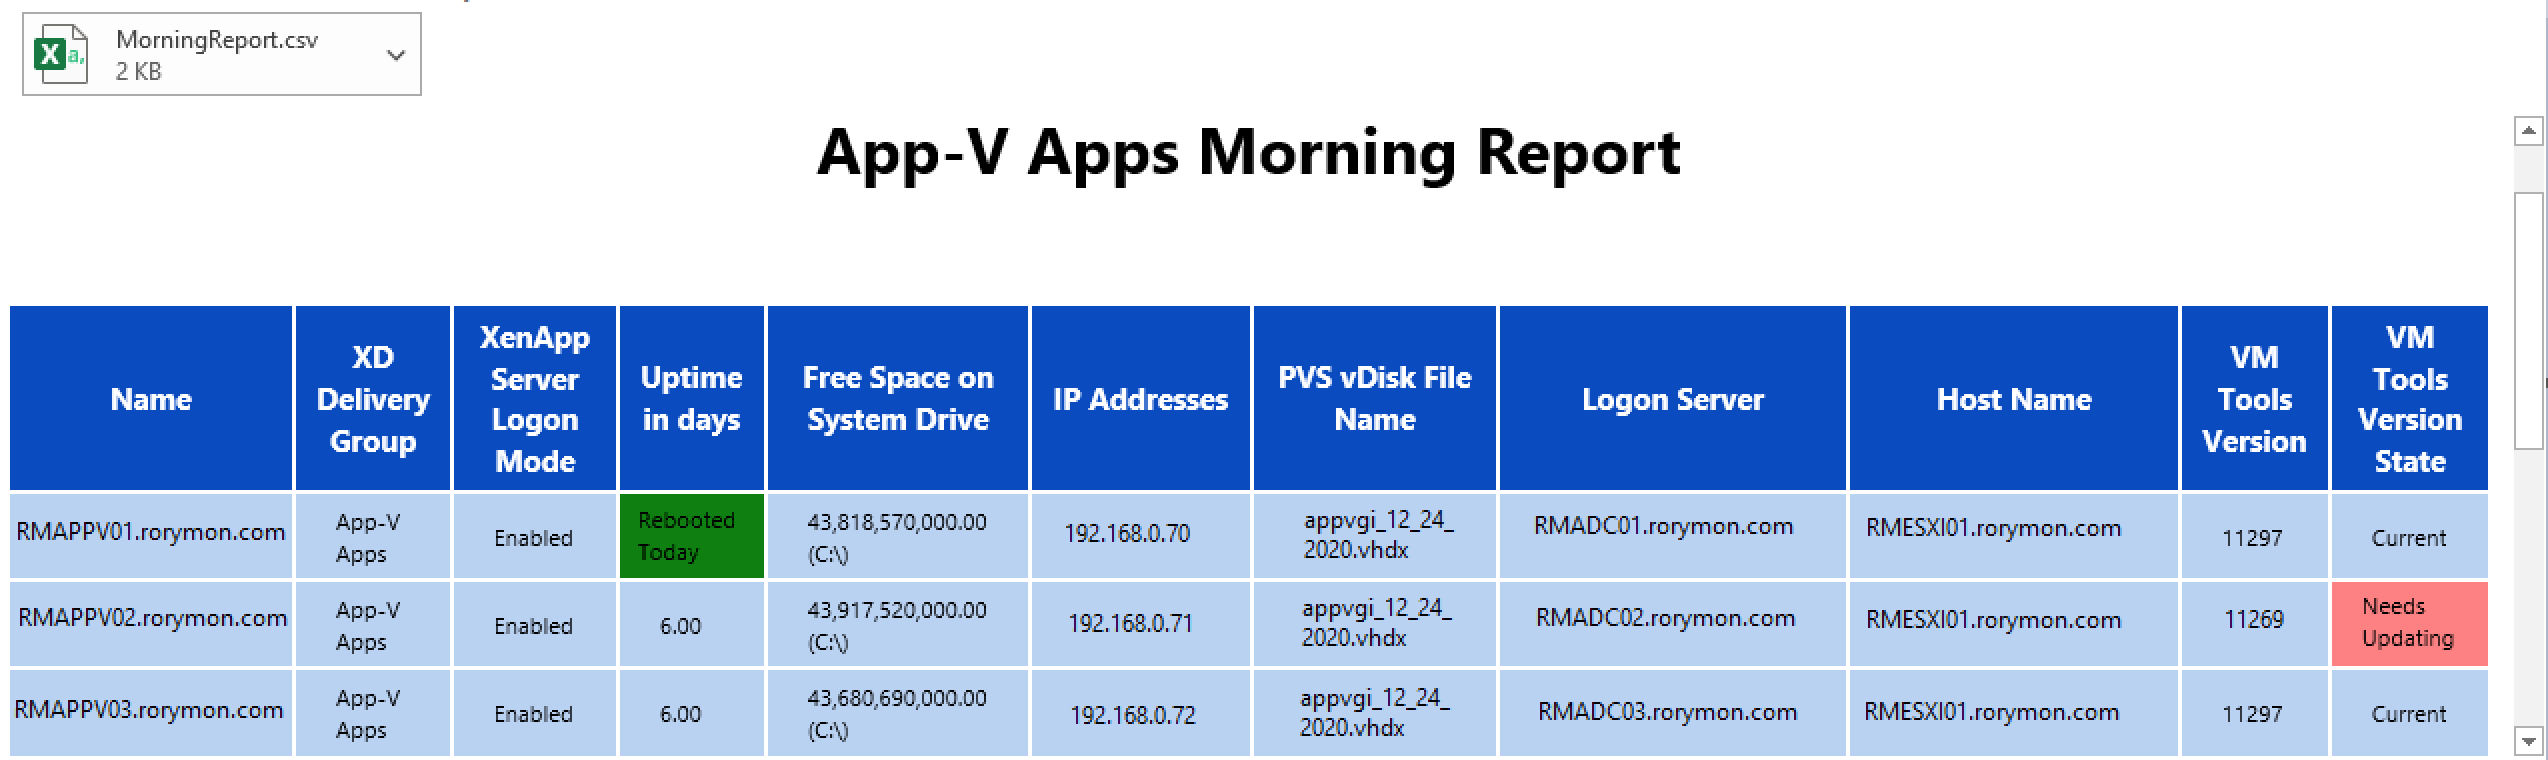
In this example, you can see some of the colour coding I have included to highlight when VMTools are out of date and to show which machines rebooted the day the report was run.
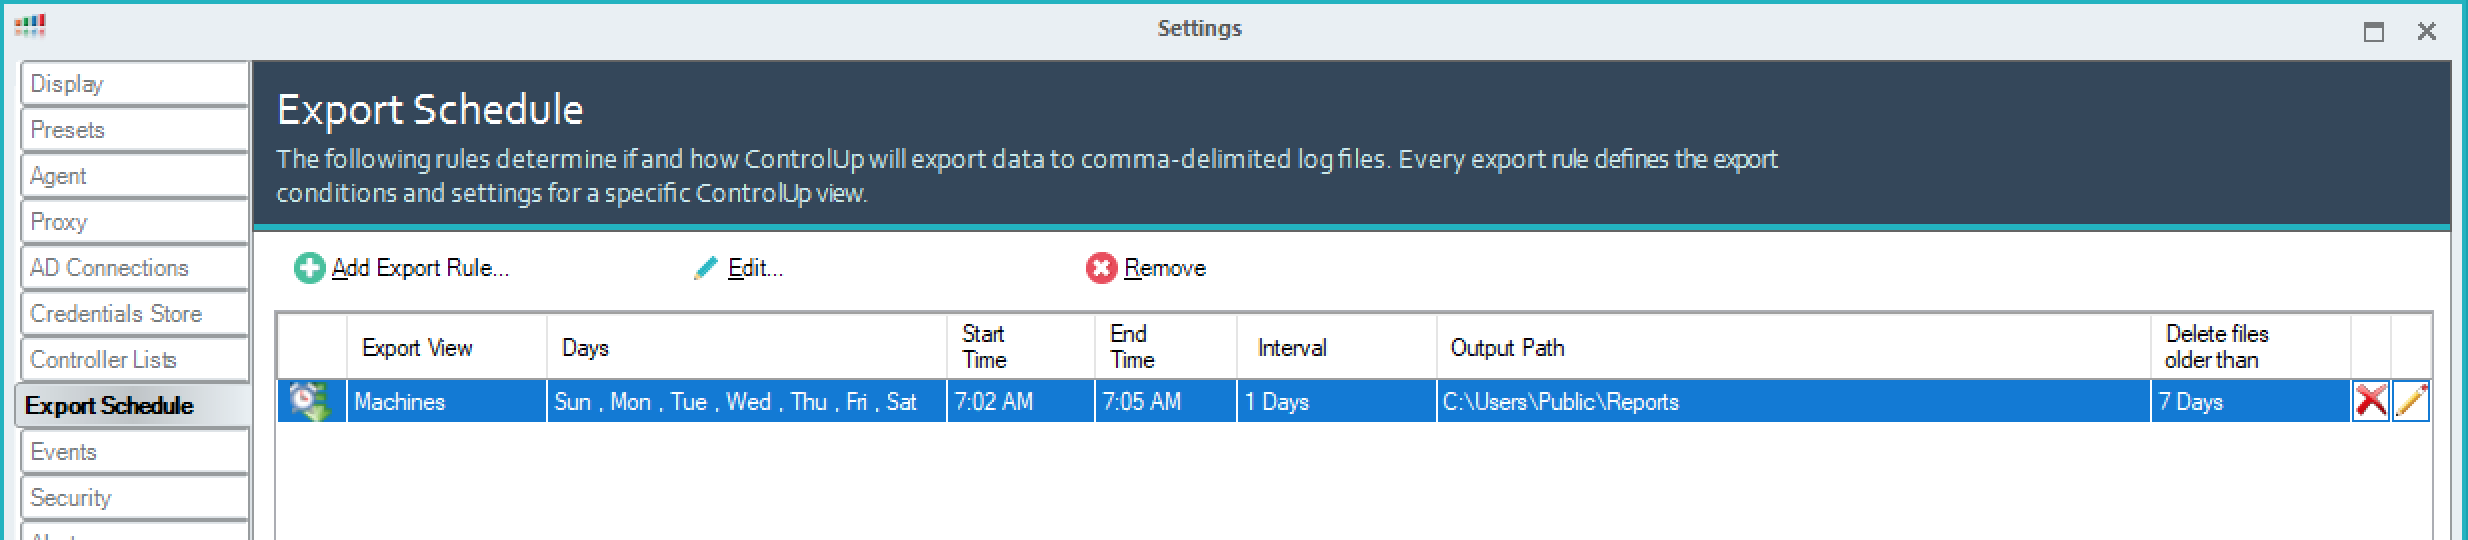
You will need to go into the ControlUp Console, navigate to Settings setup an Export Schedule. I recommend outputting to C:\Users\Public\Reports to make things easy. I choose to run an export every morning around 4am. You can set your export to run at any time you'd like.

On one of your ControlUp Monitor servers, create the directory C:\Users\Public\Reports and copy CU_MorningReport.ps1 to that location.
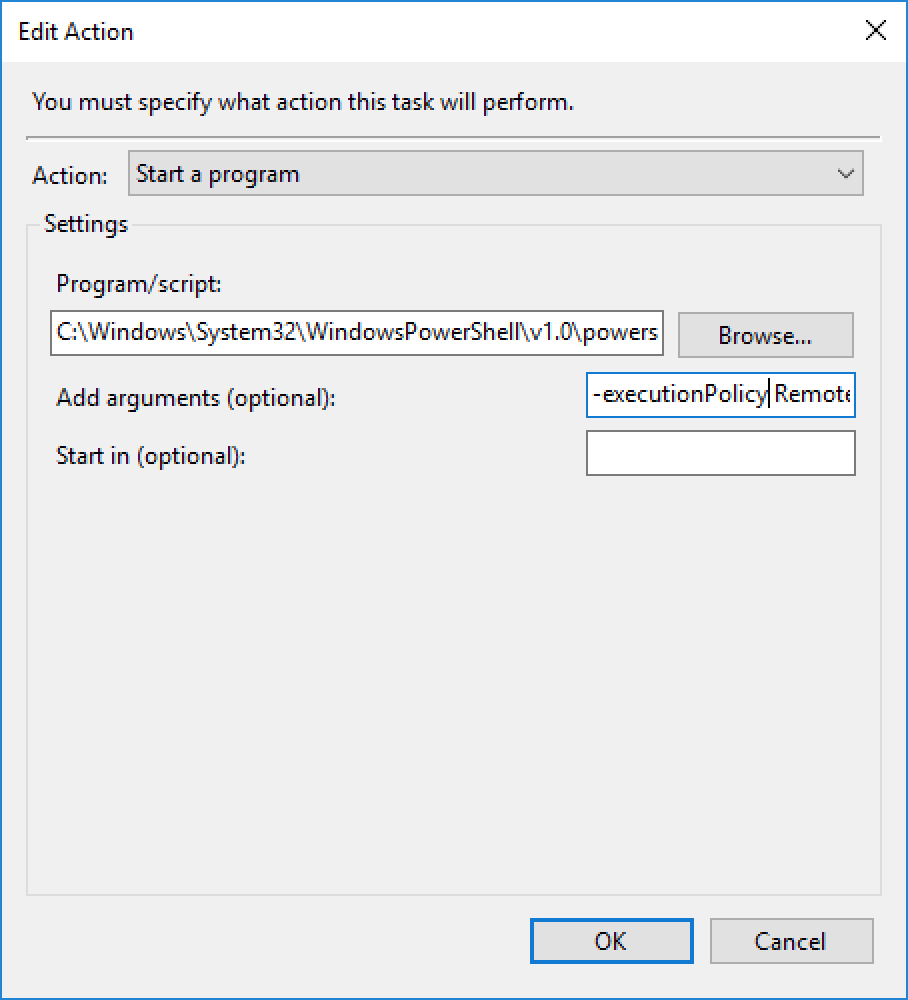
On the same ControlUp Monitor server, create a Scheduled Task and run it every day AFTER the ControlUp Export Schedule has completed. (Give that at least a 10 minute window depending on how large your environment is).
Example:
Program/script set to: C:\Windows\System32\WindowsPowerShell\v1.0\powershell.exe
Arguments set to: -executionPolicy RemoteSigned -NoLogo -file "C:\Users\Public\Reports\CU_MorningReport.ps1" -primarymon CUMONITOR01.rorymon.com -secondarymon CUMONITOR02.slhnaz.org -deliverygroup "App-V Applications" -emaildist CitrixEngineers@rorymon.com -smtpserver mymail.rorymon.com -emailfrom noreply@rorymon.com -reportdir C:\Users\Public\Reports
You can change these arguments to suit your environment and run the script to see if this report meets you needs.
If you would like to change what metrics the report displays, you can do this. Find the metrics you would like to use in one of the Export Schedule reports.
At the time this was published, examples of just some available metrics include:
Stress Level Name NetBios Status Operating System OS Version System Type CPU Logical Processors (OS) Memory Uptime Uptime in days User Sessions ICA Sessions Count Session Disconnection Rate CPU Memory Utilization Disk Queue Free Space on System Drive XenApp Load Avg. Disk Read Time Avg. Disk Write Time Net Total Sessions XenApp Server Logon Mode Net Sent Net Received Domain DNS OS Service Pack Organization Processes Install Date

Replace the above lines with the string that contains what you want to report on.
Import-Csv $secoutput | select "Name", "XD Delivery Group", "XenApp Server Logon Mode","Uptime in Days","Free Space on System Drive","IP Addresses","PVS vDisk File Name","Logon Server","Host Name","VM Tools Version","VM Tools Version State" | Export-Csv -NoTypeInformation -Path $morningreportsdir\Part2.csv```